High School GPA Calculator
We’ve built a beautiful and informative GPA calculator to help remind you of the unique value you bring to the world and that your academic goals are meant to serve you, not the other way around. Use the tool to 1) calculate your college or high school GPA (weighted or unweighted), 2) see your GPA graphed in relation to continuing education options, 3) choose a target GPA to work toward and calculate what will be needed to achieve it, and 4) enjoy artwork art work that reflects your unique set of inputs. See Instructions below for more details.
-
GPA Calculator Instructions
expand_moreGPA (or grade point average) is a common metric used to evaluate academic performance. However, all too often it is falsely conflated with intelligence. Our Memory Maps Team ascribes to the theory of multiple intelligences and recognizes that achieving a good GPA is an outcome that is a result of many factors which are rarely an indicator of overall learning potential or “intelligence”. Even so, GPA is still commonly used as an important selection criteria for admission to competitive education programs.
For this reason, getting good grades matters but perfect grades are NOT the objective. Our tool is designed to help you plan and achieve goals that are relevant to you based on real data from colleges and universities, and to help you have some fun while doing it.
To determine your GPA using our calculator, start by choosing between the college and high school GPA calculation (College GPA is selected by default). An overview of the features common to both modes is described in this section, while features specific to the two different modes are detailed in the “College GPA Calculator Instructions” and “High School GPA Calculator Instructions” below.The GPA Calculator Input Fields
The Cumulative GPA to Date section provides you with an easy way to account for your past academic work by entering your existing GPA and the total credits completed to date. These values will be used, along with individual course and semester grades, to calculate your cumulative GPA.
In the Semester section, fields are provided to enter the course name (Course Name [Optional]), letter grade (Grade), and course credits (Credits) for each course taken during the semester. While course grade and course credit are required inputs for the cumulative GPA calculation, course name is optional and is only used for your own tracking purposes and to influence the unique artwork generated from your inputs.
Additional courses can be added to a semester with the Add Course button, and additional semesters can be added with the Add Semester button. Empty fields do not constitute input for overall GPA calculation or for the purposes of your final artwork generation.
As can be seen for each semester in the Semester section, totals consisting of the semester GPA and the semester credits are summarized for convenience. These values are ultimately combined with the values provided from the Cumulative GPA to Date element to calculate your cumulative GPA. Finally, the Calculated Total Credits is the sum of all semester credits and total credits from the Cumulative GPA to Date section.The Cumulative GPA Section
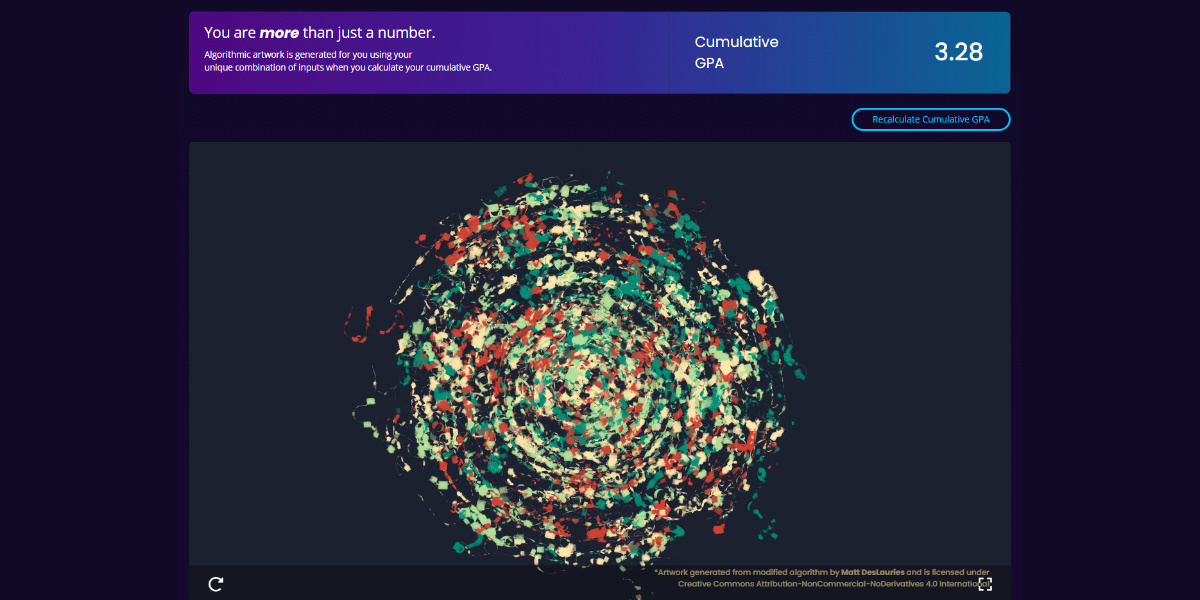
The Cumulative GPA section is simple in that it provides a Calculate Cumulative GPA button to trigger the calculation and initiate the animated artwork generation. The numerical output is visible on the right-hand side of the section.
How to Calculate GPA
The cumulative GPA calculation itself is fairly simple. Each letter grade has a corresponding numerical value (see below for the specific breakdowns for college, high school, and weighted high school GPA scales). This number for each course is multiplied by the number of credits for the corresponding course. All of these values are then added together and the sum is divided by the total number of credits providing a weighted average.
Algorithmically Generated Artwork
Our Memory Maps Team wants to inspire you and remind you that your educational journey is not just about the destination or level of attainment, but also about the unique path and choices you make along the way. To reflect this, we’ve incorporated algorithmically generated artwork that uses your unique inputs from the GPA calculator fields as the seed for its generation process. The artwork is animated as it develops toward its final image, further reflecting the unique path of evolution it, and you, take toward final form.
This relationship between the inputs provided and artwork generated are not random, which means that if you provide the same inputs you will receive the same output. Feel free to play with and explore the diversity of artwork generated from different inputs.
A social share link for the artwork is available, which allows the entire animation (not just the final image) to be shared. When you share your animated artwork, an embedded image of the final artwork will be created which will appear in your social media post. When your friends open the link, they will be able to experience the artwork animation displayed full screen just like it can be experienced at the GPA Calculator site. Because there is no clearly distinguishable correlation between the artwork generated and your inputs, you can feel confident that your GPA won’t be identifiable from the artwork.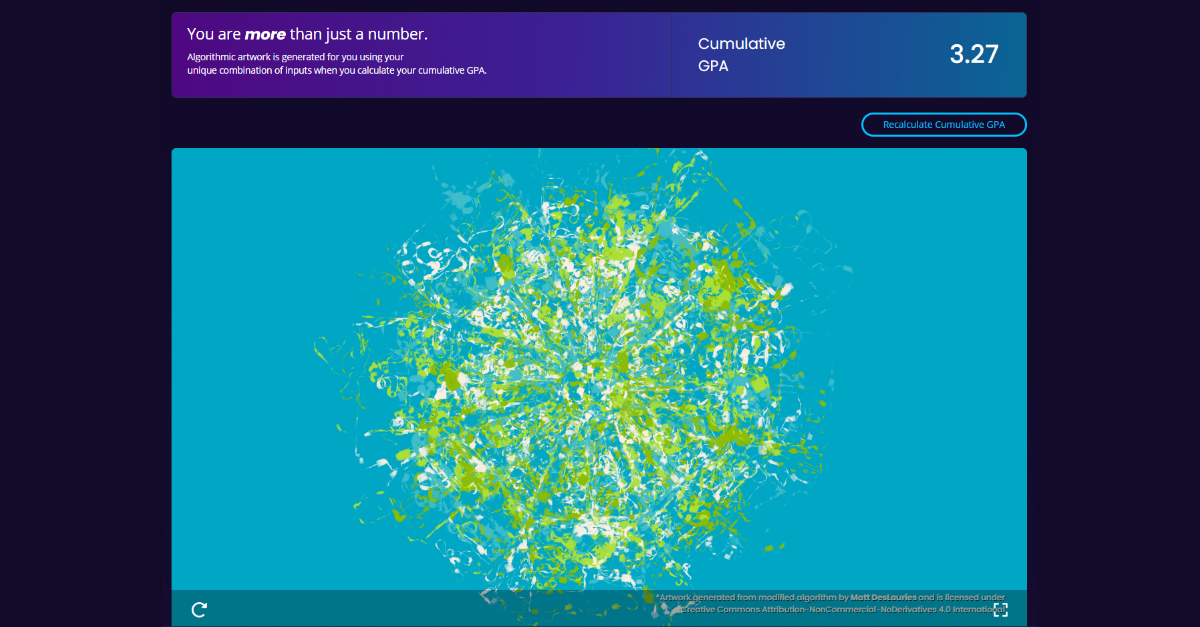

Informative Plots for Higher Education Options
Regardless of whether you are calculating your high school or college GPA, informative plots are available to help you understand the academic performance needed for higher education options. All plots show Average GPA for students accepted into the higher education options listed (on the x-axis) vs. the relevant standardized test (or entrance exam) score for the program (on the y-axis). For undergraduates, this test is the SAT, while for graduate programs it is the GRE, LSAT, or MCAT.
Individual programs are plotted as points with different colors representing their acceptance rate (or competitiveness). For desktop users, mouse over the points to receive more information about the university or school. On mobile, tap the point to open additional information, and tap anywhere outside the information field to close this field.
See your cumulative GPA plotted as a purple vertical dotted line on the graph to compare your current GPA with the averages for admitted students. A slider below the graph can be clicked and dragged to move a second vertical line to a different GPA value. This value represents your target GPA and can be used, in conjunction with the data plotted, to plan and visualize your GPA goals.Calculating Your Required GPA
The area directly below the graph contains the summary section which includes your Calculated Cumulative GPA, Target GPA, Estimated Remaining Credits and GPA Needed for Remaining Credits.
Target GPA is an editable number field which is linked to the graph slider. When the slider is moved, this value updates and when the value is updated, the slider moves.
Estimated Remaining Credits is also an editable number field to be inputted based on your program requirements. By default this value is assumed to be:
(Average Credits per Semester) x (8 Semesters) - (Total Credits from Cumulative GPA to Date Section)
If the value is calculated to be negative it is set to zero.
Finally, these three values are used to calculate your GPA Needed for Remaining Credits which gives you an indication of the GPA that must be obtained for your remaining courses/credits in order to achieve your Target GPA. This is calculated using the relationship:
Target GPA = [ ( Calculated Cumulative GPA ) / ( Calculated Total Credits ) + ( GPA Needed for Remaining Credits ) / ( Estimated Remaining Credits ) ] x ( Calculated Total Credits + Estimated Remaining Credits ).
If the Target GPA is not achievable given the Estimated Remaining Credits, the user is informed that the goal is out of range. With this tool, we hope that users like you are able to identify good academic goals for your specific objectives that are informed by real data from higher education programs.
-
College GPA Calculator Instructions
expand_moreCollege GPA Scale
It is common for universities to use a 4.0+ scale which means A+ grades are awarded a grade point of 4.3 [1]. While this is not always the case, we have included this scale as the default for the college GPA calculator because it is compatible with a 4.0 scale if the user replaces course grades of A+ with A for the purposes of calculation. The conversion from letter grades to grade points are displayed below:
4.0+ GPA Scale
Letter GradeGrade PointA+4.3A4.0A-3.7B+3.3B3.0B-2.7C+2.3C2.0D+1.3D1.0D-0.7NP0.0College GPA Graphs
We have provided plots for the most common higher education options following completion of an undergraduate college program.
Medical School
While medical school requirements differ between programs, all programs require the submission of a student’s GPA and MCAT scores. To understand the typical MCAT score range and GPAs for students accepted into medical school programs, we created a scatter plot of medical school programs with their corresponding accepted student median GPAs on the x-axis and their median MCAT scores on the y-axis. Programs are plotted as points with various colors to differentiate acceptance rates. Mouse over on desktop (or click on mobile) the points to reveal more detailed information about the schools. Data for medical school programs is from 2021 [2].
Graduate School - PhD Programs
While PhD program requirements differ between programs, all programs require the submission of a student’s GPA and GRE scores. To understand the typical GRE score range and GPAs for students accepted into PhD programs, we created a scatter plot of PhD programs with their corresponding average GPAs for accepted students on the x-axis and their average GRE scores on the y-axis. Programs are plotted as points with various colors to differentiate acceptance rates. Mouse over on desktop (or click on mobile) the points to reveal more detailed information about the schools such as GRE percentiles (25th, 50th and 75th) for the GRE Quant and GRE Verbal sections of the test as well as GPA percentiles. While data from PhD programs is from 2015 [3], it is a comprehensive data set that provides good directional guidance for planning and evaluation purposes.
Law School
While law school requirements differ between programs, all programs require the submission of a student’s GPA and LSAT score. To understand the typical LSAT score range and GPAs for students accepted into law school programs, we created a scatter plot of law school programs with corresponding average GPAs for accepted students on the x-axis and their average LSAT scores on the y-axis. Programs are plotted as points with various colors to differentiate acceptance rates. Mouse over on desktop (or click on mobile) the points to reveal more detailed information about the schools such as LSAT percentiles (25th, 50th and 75th) as well as GPA percentiles. Data for law schools programs is from 2020 and 2019 [4].
-
High School GPA Calculator Instructions
expand_moreHigh School GPA Scale
High school is typically graded on a 4.0 GPA scale which means A+ grades are awarded a grade point of 4.0 [5]. The conversion from letter grades to grade points are displayed below:
4.0 GPA Scale
Letter GradeGrade PointA+4.0A4.0A-3.7B+3.3B3.0B-2.7C+2.3C2.0D+1.3D1.0D-0.7NP0.0Weighted GPA
Weighted GPAs are typical in high schools and are calculated by awarding additional grade points depending on the type of class taken. It is thought that by providing additional grade points, educators can properly incentivize students to take more difficult courses in which they might otherwise receive lower grades. The relationship between type of course and additional grade point added can be found below; the changes are automatically applied when a user of the weighted GPA calculator enters their course types. For example, while the letter grade of B+ when received in a regular course would have an equivalent grade point of 3.3, that same letter grade received in an honors course would have a grade point of 3.8, and in an AP course have a corresponding grade point of 4.3.
Weighted GPA for Different Course Type
CourseTypeAdditional Grade PointAdvanced Placement (AP)+1.0International Baccalaureate (IB)+1.0College+1.0Enriched+0.7Honors+0.5RegularNo additionAverage GPA Graphs
Students are typically required to submit their GPA and SAT scores in order to apply for undergraduate programs at universities. To understand the typical SAT score range and GPAs for students accepted into 4-year degree programs, we created a scatter plot of colleges with corresponding average GPAs on the x-axis and average SAT scores on the y-axis. Programs are plotted as points with various colors to differentiate acceptance rates. Mouse over on desktop (or click on mobile) the points to reveal more detailed information about the schools. Data for undergraduate school programs is from 2020 and 2021 [6].
-
References
expand_more- How the General University GPA is Determined | Registrar's Office. (2021)., from https://registrar.stanford.edu/students/definition-grades/grade-point-average-gpa-and-class-rank-policy/how-general-university-gpa
- Medical School Average GPA & MCAT, Admissions Statistics and Acceptance Rates (2021) | MedEdits. (2021)., from https://mededits.com/medical-school-admissions/statistics/
- The Grad School Admissions Statistics We Never Had. (2021)., from https://debarghyadas.com/writes/the-grad-school-statistics-we-never-had/
- Top Law Schools – Rankings, Acceptance Rates, LSAT & GPA. (2021). Retrieved 15 September 2021, from https://7sage.com/top-law-school-admissions/
- How to Convert Your GPA to a 4.0 Scale. (2021)., from https://pages.collegeboard.org/how-to-convert-gpa-4.0-scale
- Data Profiles - Department of Education Open Data Platform. (2021). Retrieved 15 September 2021, from https://data.ed.gov/dataset/college-scorecard-all-data-files-through-6-2020/resources